Blog / Guide
GuideAuto Component Costing: How to Calculate Part Cost by Process

Cost It Right
Nov 21, 2026
Listen to this article
AI narration • 15:43 listen
0:00 / 15:43
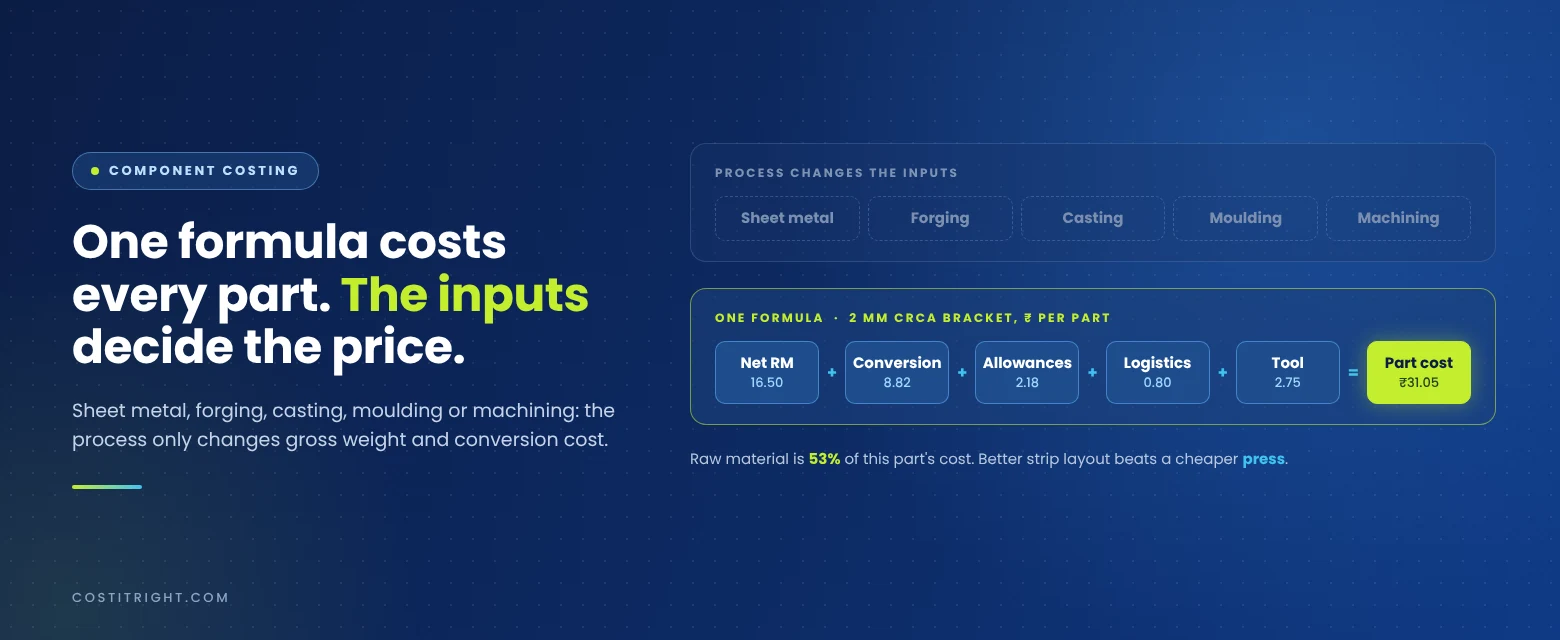
Auto component costing is the bottom-up calculation of what one part should cost to make: raw material, bought-out parts and process (conversion) cost, plus overheads, rejection, inventory carrying cost, profit, packing, freight and tool amortization. The formula is the same for a pressed bracket, a forged flange or a moulded clip. What changes by process is how you work out the gross weight and the conversion cost.
Most costing sheets we see in Tier 1 and Tier 2 plants get the formula right and the inputs wrong. A rate from last quarter, a gross weight copied from a similar part, an MHR nobody has revised since the machine was bought. Each error is small. Across 400 part numbers and three plants, they decide whether a quote wins or an amendment gets approved.
This guide walks through the cost elements, the formula, how each process changes the calculation, and one full worked example in rupees. Each process has its own detailed guide linked below.
What is auto component costing used for?
Component costing is used to price a part before it is quoted, to check a supplier's quote before it is accepted, and to revise the price when raw material or process rates move. The same cost card serves the supplier's sales team, the OEM's buyer and both finance teams.
In practice that means three situations:
Supplier side (Tier 1, Tier 2): building the quote for a new RFQ or NFR, and raising a price revision when steel, aluminium or polymer rates move.
OEM side (purchase, cost engineering): building a should-cost to negotiate against, and checking each line of the supplier's cost breakup.
Both sides, after SOP: recalculating hundreds of part prices every quarter as raw material indices move, and tracking whether tooling cost has been recovered.
The stakes are large. India's auto component industry turned over ₹7.6 lakh crore in FY2025-26, up 12.7% year on year, according to ACMA's Industry Performance Review (July 2026). Most of that revenue is priced part by part, on a cost card.
What goes into an auto component's cost?
A component cost breakup has ten elements. The first three are direct costs of making the part; the rest are allowances calculated on top of them.
# | Cost element | What it covers | How it is usually calculated |
|---|---|---|---|
1 | Raw material (RM) | Steel, aluminium, polymer, rubber compound | Gross weight × RM rate, minus scrap weight × scrap rate |
2 | Bought-out parts (BOP) | Fasteners, bushes, inserts, sub-components bought in | Quantity × BOP rate (with SOB if multi-sourced) |
3 | Process or conversion cost | Pressing, forging, machining, moulding, welding, plating | Cycle time ÷ output per hour × machine hour rate (MHR), or a rate per kg for processes like plating |
4 | Overheads | Plant running costs not inside the MHR | % on conversion cost (basis varies by OEM) |
5 | Rejection | Parts scrapped in process and at inspection | % on RM plus conversion |
6 | Inventory carrying cost (ICC) | Cost of money tied up in RM and stock | RM cost × interest rate × days of inventory ÷ 365 |
7 | Profit | Supplier margin | % on conversion cost, or on total cost (agreed with the OEM) |
8 | Packing | Bins, trays, VCI, cartons | Per part, from the packing standard |
9 | Freight | Plant to customer | Per part, from load per trip and trip cost |
10 | Tool amortization | Dies, moulds, fixtures | Tool cost ÷ committed volume, if not paid separately |
Two points trip people up. First, the percentage bases for overheads, profit and rejection differ between OEMs, so two "10% profit" quotes can differ by several rupees. Always write the base next to the percentage. Second, surface treatment is often quoted per kg or per square metre by a job worker, so it sits in conversion cost as a rate, not as an MHR calculation.
How do you calculate the cost of an auto component?
Add the material and process cost of the part, then add each allowance on its agreed base. Written as one formula:
Part cost = Net RM + BOP + Conversion cost + Overheads + Rejection + ICC + Profit + Packing + Freight + Tool amortization
where net RM cost is:
Net RM = (Gross weight × RM rate) − (Gross weight − Finished weight) × Scrap rate
The steps, in the order a cost engineer works:
Read the drawing. Material grade, thickness or bar size, finished weight, tolerances, surface treatment, annual volume.
Fix the route. List every operation in sequence: blanking, piercing, bending, welding, plating, inspection.
Work out gross weight. From strip layout, forging stock, shot weight or bar length. This is where process knowledge matters most.
Apply current rates. RM rate on the agreed base date and index, scrap rate, BOP rates.
Cost each operation. Cycle time and MHR for each machine, or a job-work rate for outsourced operations.
Add allowances on their agreed bases: overheads, rejection, ICC, profit.
Add packing, freight, and tool amortization.
Record the assumptions (rates, base dates, volumes, utilization). Without them, nobody can revise the cost later.
Step 8 is the one most sheets skip. It is also the reason a price amendment six months later turns into an argument.
How does the calculation change by manufacturing process?
The formula stays fixed; each process changes two things: how gross weight is found, and how conversion cost is built. Get those two right for the process, and the rest of the cost card follows.
Process | Gross weight comes from | Conversion cost is driven by | What buyers check first |
|---|---|---|---|
Sheet metal (pressed parts) | Blank size and strip layout (pitch, bridge, edge allowance) | Press tonnage MHR, strokes per minute, number of operations, plating | Material utilization; scrap credit at the right scrap rate |
Forging | Net weight plus flash, scale loss, bar end and tong hold | Hammer or press MHR, heating cost per kg, trimming, heat treatment, shot blasting | Gross-to-net ratio; heat treatment charged per kg vs per piece |
Casting (iron, aluminium die casting) | Poured weight (good casting plus runner, riser, overflow) and melting loss | Melting cost per kg, machine or cell rate, fettling, impregnation, machining | Yield %; melting loss assumption; returns credit |
Injection moulding | Shot weight per cavity plus runner (less regrind credit if allowed) | Machine rate by tonnage, cycle time, cavities, inserts, assembly | Cavity count vs volume; cycle time; regrind policy |
Machining | Bar or forging input weight; chips are scrap | Cycle time per operation × machine MHR, setup time spread over batch, tooling inserts | Cycle time realism; setup allocation; MHR basis |
Rubber moulding | Compound weight per cavity plus flash, cure loss | Press rate, cure time, cavities, deflashing, post-cure | Compound rate and specific gravity; cure cycle |
Two patterns hold across all six. Raw material sits in gross weight, not finished weight, so the process with more waste is more sensitive to RM price changes. And MHR sits underneath every conversion cost, which is why a wrong MHR quietly distorts hundreds of parts at once.
Worked example: costing a sheet metal bracket in rupees
A 2 mm CRCA mounting bracket with two bends and zinc plating comes to about ₹31.05 per part using the assumptions below, and raw material is 53% of that cost. Every number here is an illustrative input; replace each one with your own contract rates and norms.
Inputs and assumptions
Input | Value used | Note |
|---|---|---|
Material | CRCA, 2.0 mm | |
Gross weight per part (from strip layout) | 0.300 kg | Includes pitch, bridge, and edge scrap |
Finished weight | 0.200 kg | Material utilization 67% |
RM rate | ₹65 per kg | Benchmark 0.9 mm CRC traded around ₹64,000 to ₹66,800 per tonne in Apr to May 2026 (SteelOrbis); use your own contract rate |
Scrap rate | ₹30 per kg | Assumption |
Op 10: blank and pierce | 100 T press, MHR ₹900/hr, 6 s per part, 80% efficiency | Output: 480 parts/hr |
Op 20: bend | 63 T press, MHR ₹700/hr, 8 s per part, 80% efficiency | Output: 360 parts/hr |
Op 30: zinc plating (job work) | ₹25 per kg of finished weight | Assumption |
Overheads | 10% on conversion cost | Base varies by OEM |
Rejection | 1% on RM plus conversion | |
ICC | 12% a year on RM cost, 30 days | |
Profit | 10% on conversion cost | Base varies by OEM |
Packing and freight | ₹0.80 per part | |
Tools | Blank-pierce die ₹4,00,000 + bending tool ₹1,50,000, amortized over 2,00,000 parts | Only if tools are not paid separately |
The cost card
Element | Calculation | ₹ per part |
|---|---|---|
Gross RM | 0.300 kg × ₹65 | 19.50 |
Less scrap credit | 0.100 kg × ₹30 | (3.00) |
Net RM | 16.50 | |
Op 10: blank and pierce | ₹900 ÷ 480 | 1.88 |
Op 20: bend | ₹700 ÷ 360 | 1.94 |
Op 30: zinc plating | 0.200 kg × ₹25 | 5.00 |
Conversion cost | 8.82 | |
Overheads | 10% × 8.82 | 0.88 |
Rejection | 1% × (16.50 + 8.82) | 0.25 |
ICC | 16.50 × 12% × 30 ÷ 365 | 0.16 |
Profit | 10% × 8.82 | 0.88 |
Packing and freight | 0.80 | |
Tool amortization | ₹5,50,000 ÷ 2,00,000 | 2.75 |
Part cost | 31.05 |
What this example tells a buyer or a costing head
Utilization moves cost more than the press does. Both press operations together cost ₹3.82. Improving the strip layout so gross weight falls from 0.300 kg to 0.270 kg saves about ₹1.05 per part, more than a quarter of the entire press cost.
Steel price sensitivity is easy to size. A ₹5 per kg rise in CRCA adds ₹1.50 per part (0.300 kg × ₹5), about 5%. On 2,00,000 parts a year that is ₹3 lakh, from one part number.
Tool amortization is a volume bet. At ₹2.75 per part it is nearly 9% of the price. If the programme runs at 1,20,000 parts instead of 2,00,000, about ₹2.2 lakh of tool cost is never recovered unless the contract protects it.
Percentage bases matter. Change profit from "10% on conversion" to "10% on total cost" and profit jumps from ₹0.88 to about ₹3.02 per part (10% of the ₹30.17 cost before profit). Same percentage, very different quote.
ZBC, VBC or CBC: which costing method should you use?
Use zero-based costing (ZBC) when you need to know what a part should cost from first principles, vendor-based costing (VBC) when you are evaluating what a supplier says it costs, and client-based costing (CBC) when you are a supplier checking what your customer's cost model allows. Most mature purchase teams run all three on the same part and study the gaps.
Method | Built from | Best used for | Watch out for |
|---|---|---|---|
ZBC (zero-based costing) | Your own engineering: drawing, route, rates, norms | New part negotiation; should-cost targets | Assumptions that ignore the supplier's real process |
VBC (vendor-based costing) | The supplier's submitted cost breakup | Comparing quotes line by line; spotting padding | Suppliers using different formats, so lines do not compare |
CBC (client-based costing) | The customer's costing norms and formats | Suppliers responding to an OEM RFQ or amendment | Norms that differ from your actual plant costs |
The gap between ZBC and VBC is the negotiation. The gap between CBC and your internal cost is your real margin.
We will cover this in depth in a separate post on ZBC vs VBC vs CBC; until then, see our guide on zero-based costing in procurement.
Where does spreadsheet costing break?
A spreadsheet handles one part well. It breaks when the same rate feeds hundreds of parts across plants and suppliers, and someone has to change that rate, explain the change, and prove who approved it.
The failure points we hear about most from costing and purchase teams:
One RM rate, 600 files. When CRCA moves ₹3 per kg, every sheet that uses it has to be found and updated by hand. Some never are, and the PO price drifts away from the cost card.
No version history. The sheet shows today's cost. It cannot show what was approved last quarter, by whom, and why it changed.
Formats that do not compare. Five suppliers send five breakups. Before anyone can compare them, someone retypes them into one format, and L1 gets picked on the total because the lines do not line up.
MHR and overhead norms nobody owns. Each plant keeps its own copy. Two plants cost the same part differently and nobody notices until an audit.
Knowledge walks out. The person who built the costing logic leaves, and the formulas become a black box.
None of these are formula problems. They are data, version and approval problems, which is why a better template alone does not fix them past a few hundred parts.
How do leading manufacturers run component costing at scale?
They keep the formula and move the masters, approvals, and history into one system. In Cost It Right, rates, MHRs, overheads and norms live as shared masters, every part's cost card is built from them, and a rate change is simulated to finished-good level before anyone approves it.
What that looks like in practice:
Standard costing formats for 24+ technologies, including sheet metal, forging, casting, plastic, rubber and machining, so every plant and supplier fills the same lines.
ZBC, VBC and CBC on the same part, with cost version history and side-by-side comparison.
Raw material indexation: link RM to external indices such as LME, then see the impact on every affected part, plant and finished good before the amendment is approved.
A vendor RFQ portal where every supplier submits in the same standard format, so quotes compare line by line, including tooling and payment terms.
Multi-level approvals and a full audit trail with reason codes and timestamps.
Reports such as Cost Variance, Cost Ratio, PI/PD, and Tool Amortization Alerts, which flag tools as they approach and pass their planned recovery volume.
The results are measurable. One multi-plant auto component group cut end-to-end costing time by 60% and now saves about 7,000 man-hours a year. At a leading two-wheeler OEM, work that took 1,920 man-hours is now done in 3 hours.
See how leading OEMs and Tier 1 suppliers run component costing in Cost It Right. Book a demo.
FAQs
What is the formula for auto component cost?
Part cost = net raw material + bought-out parts + conversion cost + overheads + rejection + ICC + profit + packing + freight + tool amortization. Net raw material is gross weight times RM rate, minus scrap weight times scrap rate.
What is a cost breakup in the auto industry?
A cost breakup is the line-by-line split of a part's price into the elements above, usually in a format the OEM specifies. Buyers use it to compare suppliers and to check each line against their own should-cost.
What share of an auto component's cost is raw material?
It depends on the process. BigMint (SteelMint) has reported material at around 75% of the cost structure in automotive manufacturing. In our bracket example it is 53%, because plating and tool amortization add significant non-material cost.
Why does machine hour rate matter so much in component costing?
MHR is inside every operation's conversion cost, so one wrong MHR distorts every part that runs on that machine. Keep MHR as a shared master, revise it when power, labour or utilization change, and record the utilization it assumes.
Should tool cost be included in the piece price?
Only if the OEM is not paying for the tool separately. If it is amortized into the price, record the committed volume, because the supplier carries the shortfall if actual volumes come in lower.
Related Articles

Aug 31, 2026 • 14 min read
RFQ Automation for Manufacturing Buyers: What Most Tools Get Wrong
Most RFQ tools compare supplier quotes to each other, not against a fair cost. What buyer-side RFQ automation for manufacturers actually needs.

Sep 22, 2026 • 9 min read
How to Automate BOM-Level Quoting Without Losing Price Accuracy
How to automate BOM-level quoting for RFQs and why a clean supplier comparison isn't the same as a fair price. A practical guide.

Aug 20, 2026 • 17 min read
Supplier Quote vs Should-Cost: How Manufacturers Can Find the Real Cost Behind a Price
Know the difference between a supplier quote and should-cost, why supplier prices vary, and how procurement turns that gap into leverage.