
Table of Contents
The supply chain control process is the loop that keeps a supply chain on plan. For each stage you set a target, measure what actually happens, and act when the two drift apart. ASCM’s dictionary describes supply chain management as the “design, planning, execution, control, and monitoring” of supply chain activities, so control is built in, not bolted on.
Most guides stop at the stages: plan, source, make, deliver, return. This one adds the part they skip: what to measure at each stage, when to step in, and who steps in. The examples come from manufacturing, where the work is buying direct materials and components.
The Supply Chain Control Process at a Glance
Each stage has one thing to control, one metric that shows drift, and one trigger for stepping in. The table is the whole process on one page, and the sections after it explain each row.
| Stage | What you control | Metric to watch | Step in when | Typical response |
|---|---|---|---|---|
| Plan | Whether the plan still matches demand and input costs | Forecast error; planned versus current material price | Either leaves the tolerance band you set | Re-plan quantities, safety stock and part costs |
| Source | Price, supplier reliability and dependency | Quote versus should-cost gap; supplier on-time delivery; share of spend on single-source parts | A quote sits above its should-cost, or a supplier misses its delivery target | Challenge the line item, escalate, qualify a second source |
| Make | Yield, material use and tooling spend | Scrap rate; material utilization; tool amortization versus quantity produced | Scrap or tooling drifts from the standard the cost was built on | Fix the process, revisit tool life, update the part cost |
| Deliver | Whether orders arrive on time and complete | On-time-in-full rate; inventory turns; days of stock | On-time-in-full falls below target, or stock builds without better service | Re-route, rebalance stock, expedite |
| Return | Why products come back | Return rate by reason code; time to disposition | The same reason code repeats | Send the cause back to Make or Source |
The tolerance in the “step in when” column is yours to set, and it belongs in the plan. A threshold decided after the drift has happened is a debate, not a control.
Effective product distribution means each of these stages is working smoothly. Unexpected delivery hurdles may occur due to environmental reasons or faults in vehicles. Your supply chain must be ready to handle them.
How Does the Control Loop Work?
The loop has four steps that repeat: set a target, measure the result, compare the two, and act on the gap. It is the same at every stage. Only the target and the measure change.
- Set the target from the plan. For a purchased part, that is the material price the quote assumed.
- Measure what happened. The current index price, the delivered quantity, the scrap actually logged.
- Compare against a tolerance band, not an exact number. A band keeps routine noise from triggering action.
- Act, with an owner and a date, and record the outcome. The next plan should start from what this one taught.
The SCOR model from ASCM describes the same idea inside its Plan process: balancing requirements against resources to find gaps, then “identifying actions to correct these gaps.”
Two clarifications. A control tower, usually software that shows the current state of the chain, is not the control process. The tower shows; the process decides what to do about it. And a control that watches only one stage misses drift that starts in the one before. A wrong price assumption in planning shows up as a sourcing variance weeks later, and by then it looks like a supplier problem.
Stage by Stage: What to Control and How
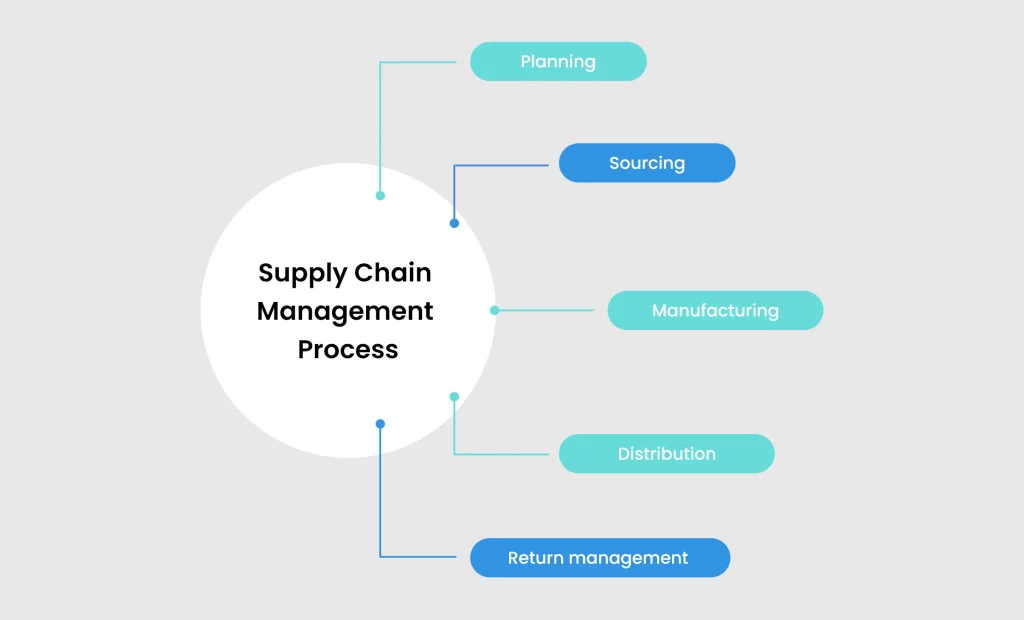
Read the five stages as five separate control points, because each one fails in a different way.
-
Plan: control the assumptions, not just the forecast
Planning control means checking that the assumptions behind the plan, demand and input prices, still hold. Forecast error tells you demand has moved. The gap between the planned material price and the current index tells you cost has moved. For a manufacturer the second is easier to miss, because it sits in a costing sheet rather than in the demand plan.
Watch forecast error and the planned-versus-current material price. Step in when either leaves its band, and re-plan quantities, safety stock and part costs together. The raw material price volatility guide covers how to write a price band into supplier contracts.
-
Source: control price and dependency
In sourcing, control means every quote is checked against what the part should cost, and dependence on single suppliers is visible. Two metrics do most of the work: the gap between a quote and its should-cost, and each supplier’s on-time delivery against target. A third, the share of spend sitting on single-source parts, shows how exposed you are if one supplier fails.
When a quote sits above its should-cost, challenge the line item that carries the gap. Supplier cost breakdown analysis shows how to read a quote line by line, and BOM-level quoting covers doing it across hundreds of lines.
-
Make: control yield, material use and tooling
Production control means scrap, material use and tooling spend stay close to the standard the cost was built on. Scrap rate and material utilization show whether the process is wasting input, and material utilization often matters more than the material price itself.
Tooling needs its own control. The tool is paid for up front and recovered through the piece price over expected volume, so it should be tracked against the quantity actually produced. Cost It Right’s Tool Lifecycle and Amortization Alert Report, for example, flags a tool green below 80% of its amortization, orange from 80% to 100%, and red above 100%. Where the tool cost is built into the piece price, the price should step down once the tool is recovered. That only happens if someone is watching.
-
Deliver: control the promise made to the customer
Delivery control means orders arrive on the agreed date, in the agreed quantity. A simple way to start is on-time-in-full: the share of order lines that arrive on time and complete. ASCM’s SCOR standard lists Perfect Order Fulfillment (RL.1.1) as a level-1 reliability metric, and on-time-in-full is a practical first step toward it.
Pair it with inventory turns and days of stock. Fixing lateness by holding more stock only moves the cost from one line to another. Step in when on-time-in-full drops below target, or when stock builds without a matching rise in service.
-
Return: control the cause, not just the refund
Return control means tracking why products come back and sending the cause upstream. SCOR describes returns as diagnosing the condition, deciding entitlement, and sending the item back into the process or another disposition. The metrics are return rate by reason code and time to disposition.
The signal to watch is one reason code repeating. That is a defect or a specification problem that belongs to Make or Source, not to customer service.
Worked Example: Catching a Raw Material Price Drift Before It Reaches the Quote
A price band written into the plan turns a slow margin leak into an alert with a date on it. The numbers below are illustrative, not a benchmark.
A machined aluminum part uses 0.4 kg of material. The plan assumed aluminum at $2,600 per tonne and 120,000 parts a year. The team set a tolerance of plus or minus 5%, which puts the trigger at $2,730 per tonne.
Purchase price variance is (actual price minus standard price) times quantity. Applied to this part:
| Index price | Change versus plan | Extra cost per part | Extra cost per year |
|---|---|---|---|
| $2,730 per tonne | +5.0% | $0.052 | $6,240 |
| $3,000 per tonne | +15.4% | $0.160 | $19,200 |
If the only check is a quarterly cost review, the drift surfaces after the exposure has grown to the full $19,200. With the band, the alert fires at $2,730, when the exposure is about $6,240 a year, and the owner has time to re-cost the part, apply an indexed clause if the contract has one, or renegotiate. The band did not stop the price moving. It moved the moment of finding out earlier.
Is the Five-Stage Model Still the Standard?
It is still the working model most teams use and most guides teach, but the current standard from ASCM is organized differently. ASCM’s SCOR Digital Standard has six level-1 processes, Plan, Order, Source, Transform, Fulfill and Return, with Orchestrate sitting above them.
| Common five-stage name | SCOR Digital Standard process |
|---|---|
| Plan | Plan |
| Source | Source |
| Make | Transform |
| Deliver | Order and Fulfill |
| Return | Return |
| Not named | Orchestrate (sits above the other six) |
The five-stage view matches the older SCOR steps. The current version splits Deliver into Order and Fulfill, renames Make to Transform so the model fits services as well as manufacturing, and adds Orchestrate.
Orchestrate is the part that matters for this guide. ASCM’s description of it lists business rules, risk mitigation and performance management among its activities, which is where tolerance bands and response rules belong. Earlier versions of this page taught the five-stage view. It remains useful, and the control loop above works with either structure.
Where Cost It Right Fits in the Control Process
Cost It Right covers the cost and supplier side of this loop for manufacturers: price assumptions at planning, quote checks at sourcing, and tooling and cost variance in production. It does not run warehouses, transport or returns.
- Plan: The Commodity Movement report shows how the net landed rate for a material code moves over time across plants and vendors. The Cost Impact with External Indexing simulation shows the effect on part costs before a price amendment takes effect.
- Source: The RFQ Comparison Report lays every vendor quote for one RFQ side by side. Master Benchmarking compares raw material, bought-out part, machine and operation rates across vendors and plants. The Supplier Onboarding Dashboard tracks onboarding by stage and turnaround time, and Spend Analysis shows where material spend concentrates.
- Make: The Cost Variance report compares a part’s cost structure element by element across vendors, plants or versions. The Tool Lifecycle and Amortization Alert Report sends the green, orange and red tooling flags described above.
- Across stages: The Weekly Approval Delay Summary emails pending requests by user and department, so a triggered response has an owner and does not stall in a queue.
The product overview lists the modules behind these reports.