

Table of Contents
What Is Supplier Cost Breakdown Analysis?
Why Does the Bottom-Line Price Hide More Than It Reveals?
What’s the Difference Between Cost Analysis and Price Analysis?
What Should a Legitimate Supplier Cost Breakdown Include?
How Do You Read Each Line Item Correctly?
What Are the Red Flags of a Padded or Inflated Breakdown?
Worked Example: How Much Padding Can Hide Inside a “Competitive” Quote?
How Do You Challenge a Line Item Without Damaging the Relationship?
What Are the Limitations of Cost Breakdown Analysis?
Why Doesn’t Generic Procurement Content Cover This Well?
How Does Cost It Right Make This Systematic Instead of Manual?
FAQs
What Is Supplier Cost Breakdown Analysis?
Supplier cost breakdown analysis is the process of decomposing a vendor’s quoted price into its individual cost elements, material, labor, manufacturing overhead, tooling, SG&A, and profit, and evaluating each one on its own terms rather than judging the quote only by its total.
The practice has deep roots in automotive manufacturing, where OEMs required suppliers to submit itemized cost structures alongside quotes, originally to support joint value-engineering and continuous cost-reduction programs rather than as a one-off negotiation tactic. That origin still shapes how it’s used today: the goal isn’t to squeeze a supplier’s margin to zero, it’s to confirm that a price reflects real costs rather than an inflated estimate, and to give both sides a shared, factual basis for the conversation when costs genuinely change.
Why Does the Bottom-Line Price Hide More Than It Reveals?
Two suppliers can quote the identical total price and arrive at it through very different, and very differently fair, cost structures, one built honestly from real material and labor data, the other padded in overhead or profit and offset by a thin, competitive material margin that makes the total look fair.
Comparing totals, or even comparing several suppliers’ totals against each other, never surfaces that difference, because the padding isn’t in the number you’re comparing, it’s in a line item buried inside it. This matters most exactly where it’s hardest to catch by instinct: custom parts, sole-source components, and tooling-heavy purchases, where there’s no simple market price to check the total against, and the breakdown itself is the only real window into whether the price is fair.
What’s the Difference Between Cost Analysis and Price Analysis?
Price analysis compares a quoted price against external references, other quotes, market prices, or historical pricing. Cost analysis examines the supplier’s own individual claimed cost elements to judge whether each is reasonable. They’re often used interchangeably in procurement conversations, but they require different inputs and suit different situations.
| Price Analysis | Cost Analysis | |
|---|---|---|
| What it examines | The quoted price itself, against external references | The supplier’s individual claimed cost elements |
| What it requires | Comparable market data, other quotes, or historical pricing | The supplier’s cost breakdown, or your own independent cost estimate |
| Best suited to | Standard or commodity items with active market competition | Custom, complex, or sole-source items where market comparables are thin |
| What it tells you | Whether this price is in line with what others charge | Whether each individual cost element is itself reasonable |
Price analysis is faster and needs nothing from the supplier beyond the quote itself. Cost analysis requires more, either a detailed breakdown from the supplier or an independent should-cost estimate of your own, but it’s the only approach that works when there’s no reliable external price to compare against, and the only one that shows where in a quote any padding actually sits.
What Should a Legitimate Supplier Cost Breakdown Include?
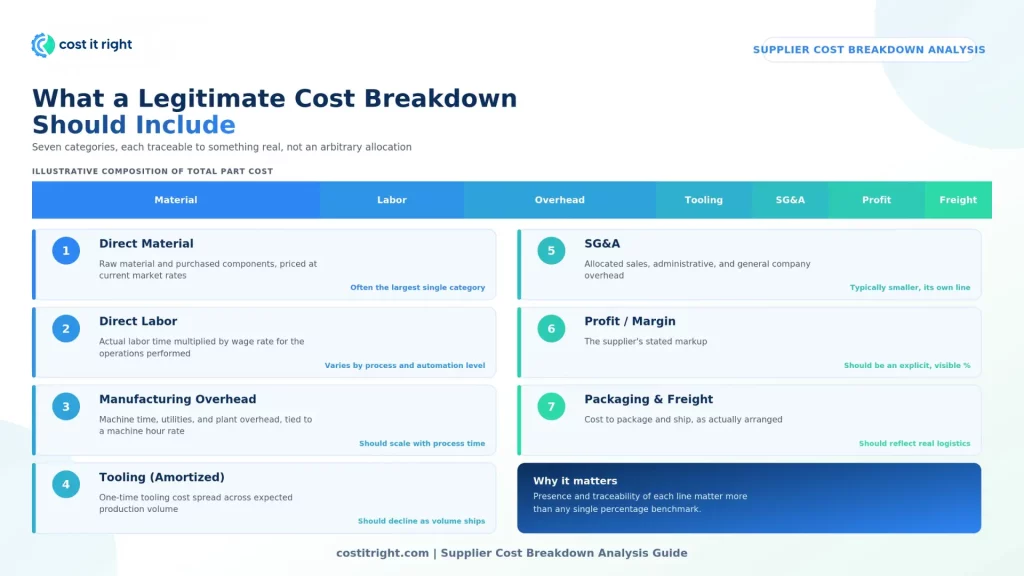
A properly structured breakdown separates a part’s cost into distinct, individually justifiable categories instead of one opaque number. Seven categories should appear, each traceable to something real rather than an arbitrary allocation:
| Category | What It Should Include | Typical Share of Total Cost |
|---|---|---|
| Direct Material | Raw material and purchased components, priced at current market rates | Often the largest single category for discrete manufactured parts |
| Direct Labor | Actual labor time multiplied by wage rate for the operations performed | Varies significantly by process and automation level |
| Manufacturing Overhead | Machine time, utilities, and plant overhead, tied to a machine hour rate | Should scale with actual process time, not a flat percentage |
| Tooling (Amortized) | One-time tooling cost spread across expected production volume | Should decline over time as volume ships against it |
| SG&A | Allocated sales, administrative, and general company overhead | Typically smaller, and should be its own line, not buried in overhead |
| Profit / Margin | The supplier’s stated markup | Should be an explicit, visible percentage |
| Packaging & Freight | Cost to package and ship, as actually arranged | Should reflect the real logistics arrangement, not a placeholder |
Treat the “typical share” column as context for what a category should scale with, not a fixed benchmark, the specific percentages vary enormously by industry, process, and part complexity. What matters more than any single percentage is whether each category is present, separately stated, and traceable to something real rather than folded into a single markup figure.
On profit margin specifically: manufacturing suppliers commonly report net margins in roughly the 5-15% range, while specialized service or engineering-heavy suppliers may run 20-30% or higher. These are broad, commonly cited ranges, not a rule to hold every quote against, use them as a sanity check for outliers, then benchmark the specific supplier against comparable vendors in your own supply base for anything that actually matters to a negotiation.
How Do You Read Each Line Item Correctly?
Each cost category should be traceable to a specific, checkable source, not just a number on a page. Here’s what to ask for behind each one:
Material. Should trace to a current market rate or mill quote for the specific grade and gauge specified, not a rounded, generic commodity price. Ask what index or quote date backs the figure.
Labor. Should trace to an actual cycle time or time study for the operations involved, multiplied by a stated wage rate. A labor line with no time or rate behind it is effectively a placeholder.
Manufacturing overhead. Should be calculated from an actual machine hour rate for the specific process and machine, not applied as a flat percentage of labor or material. A flat “20% overhead on labor,” applied uniformly regardless of which machine or process is used, is a sign the number wasn’t built from real process data.
Tooling. Should show total tool cost and the amortization basis, tool cost divided by expected volume, so you can check whether the volume assumption is realistic and the tool cost itself reasonable for its complexity.
SG&A and profit. Should appear as their own explicit lines. A quote that folds overhead, SG&A, and profit into a single “markup” percentage makes it impossible to tell whether any padding sits in company overhead or in margin, which changes how you’d negotiate it.
What Are the Red Flags of a Padded or Inflated Breakdown?
A handful of patterns show up consistently in breakdowns worth a closer look:
- Round numbers everywhere. Real costs built from actual data rarely land on clean round figures across every line. A breakdown where material, labor, and overhead all end in tidy round numbers is more likely reverse-engineered from a target total than built bottom-up.
- Overhead or profit that doesn’t move. If material or labor costs change between revisions but overhead and profit stay exactly the same dollar amount, they’re likely fixed numbers held constant, not figures actually tied to the process.
- A catch-all “other” or “miscellaneous” line. Legitimate cost structures rarely need one. When one appears, it’s worth asking about directly.
- Numbers that don’t sum correctly. A breakdown whose line items don’t add up to the quoted total, even by a small amount, suggests it was built after the fact to justify a number decided earlier.
- Inconsistent basis across lines. Mixing per-piece and per-hour, or per-unit and per-batch, without reconciling them clearly, makes a breakdown hard to verify by design, intentionally or not.
- Missing tooling detail on tooling-heavy parts. A single lump-sum tooling number with no visible amortization basis leaves you unable to check whether the volume assumption behind it is realistic.
None of these individually proves a supplier is padding a quote. Each is a reason to ask a direct question about that specific line before accepting the number behind it.
Worked Example: How Much Padding Can Hide Inside a “Competitive” Quote?
A supplier quotes a machined bracket at $9.00, broken down as:
| Line Item | Quoted Amount |
|---|---|
| Material | $4.20 |
| Labor | $1.10 |
| Overhead | $2.80 |
| Profit | $0.90 |
| Total | $9.00 |
Next to a couple of comparable quotes in a similar range, $9.00 doesn’t look unusual. But the overhead line deserves a second look: $2.80 against $1.10 of labor implies an overhead rate of roughly 255%, with no visible basis. Asking for the machine hour rate and cycle time behind that figure gets a straightforward answer: an MHR of $45 per hour and a cycle time of 2.2 minutes, about 0.037 hours. That works out to a process cost of roughly $1.65, not $2.80.
That single question surfaces about $1.15 of unexplained overhead inside a total that looked entirely reasonable next to competing quotes. Comparing this quote’s bottom line to competitors’ bottom lines would never have caught it, the padding wasn’t in the total, it was in one specific line inside it. This is also, worth noting directly, exactly the kind of gap a plain price comparison across suppliers is structurally unable to find, no matter how many quotes you collect.
How Do You Challenge a Line Item Without Damaging the Relationship?
- Ask for the basis, don’t state a conclusion. “Can you walk me through how the overhead figure was calculated?” gets more useful information, and less friction, than “this overhead number looks padded.”
- Anchor the question in your own model, not a feeling. Bringing an independent should-cost estimate to the conversation turns the discussion into comparing two calculations rather than a supplier defending against an accusation.
- Focus on the specific line, not the whole quote. Challenging one line with a real discrepancy is a normal part of a costing conversation. Challenging every line on principle reads as adversarial and tends to slow the relationship without improving the outcome.
- Know which gaps are worth pushing on. A few percent of variance on a minor line usually isn’t worth spending relationship capital over. A large, unexplained gap on a major cost driver is.
- Keep a record of what you find. A discrepancy resolved once tends to reappear on the next quote if nothing connects this RFQ back to the last one for the same supplier and part family.
What Are the Limitations of Cost Breakdown Analysis?
Cost breakdown analysis is a genuinely powerful tool, but it isn’t free of real limitations worth acknowledging directly rather than glossing over.
It depends on supplier cooperation. A supplier can decline to provide a detailed breakdown, or provide one that’s intentionally vague, particularly for competitively sensitive components or when the relationship is transactional rather than strategic. No amount of analytical skill fixes a breakdown a supplier won’t actually give you.
It’s resource-intensive to do properly. Reading a breakdown line by line, checking it against machine hour rates and material indices, and following up on discrepancies takes real time. Doing this manually for every RFQ, rather than the handful of high-value or high-risk components where it matters most, isn’t realistic for most costing teams.
It doesn’t capture everything that affects total cost. Quality risk, switching costs, supplier reliability, and relationship value don’t show up in a cost breakdown, and a supplier with a slightly higher but well-justified quote can still be the better choice once those factors are weighed in.
It relies on the accuracy of what’s disclosed. A cost breakdown is only as reliable as the honesty and diligence behind it. Validating a supplier’s figures against independent benchmarks, rather than accepting them at face value, is part of the discipline, not an optional extra step.
Why Doesn’t Generic Procurement Content Cover This Well?
Most procurement advice on evaluating supplier quotes stops at negotiation tactics, payment terms, volume discounts, contract length, that apply broadly across categories of spend, from office supplies to raw materials. That content is useful, but it isn’t built to teach the specific mechanical skill this post covers: reading a manufacturing cost breakdown structure and knowing what each line should actually contain.
That gap exists because the skill requires manufacturing cost accounting knowledge, machine hour rates, tooling amortization, material yield and scrap allowances, that general indirect-procurement content has no reason to cover. A generic guide can teach you to ask a supplier for a breakdown. It generally can’t teach you what a legitimate overhead calculation should look like once you have one in front of you.
How Does Cost It Right Make This Systematic Instead of Manual?
Doing this manually, on every RFQ, for every line item, doesn’t scale past a handful of high-value components, which is exactly the limitation described in Section 9. Cost It Right’s Cost Ratio report breaks every quoted part into the same structured categories, raw material, bought-out parts, process cost, packing, freight, overheads, profit, and tooling, automatically, so the breakdown a costing team is evaluating is already in a consistent, comparable format rather than whatever structure a given supplier chose to present.
The Cost Variance report goes further, comparing that same part’s cost structure element by element across vendors, plants, or time, so an overhead line that’s unusually high isn’t just visible on its own, it’s visible against what the same cost element looks like for the same part elsewhere in your supply base. Master Benchmarking extends this across your full vendor and plant network, showing the minimum, maximum, and weighted-average rate for a given material, process, or component category, so a costing engineer isn’t relying on memory or instinct to know whether a specific line looks high, there’s an actual benchmark behind the question.
That’s the difference between challenging a supplier’s cost breakdown as a one-off manual exercise, and running the same structured challenge on every RFQ as a routine part of the costing process, without needing to redo the analysis from scratch each time.e specific combination missing across every category of RFQ tool on the market today.
FAQs
Supplier cost breakdown analysis is the practice of reviewing the individual cost elements behind a supplier’s quoted price, material, labor, overhead, tooling, and profit, to assess whether each one is reasonable, rather than only evaluating the total quoted price.
Price analysis compares a quoted price against external references like other quotes or market prices. Cost analysis examines the supplier’s individual claimed cost elements to assess whether each is reasonable on its own. Price analysis suits standard items with active market competition; cost analysis is necessary for custom or sole-source items with no reliable market comparison.
They’re closely related but not identical, and treating them as fully interchangeable, as some procurement content does, misses a useful distinction. Should-cost analysis builds an independent, bottom-up cost estimate calculated without reference to any supplier’s quote. Cost breakdown analysis examines a specific supplier’s own claimed cost structure. In practice they work together: a should-cost estimate gives you the independent benchmark to evaluate a supplier’s breakdown against.
A complete breakdown should separately show direct material, direct labor, manufacturing overhead, tooling amortization where applicable, SG&A, profit, and packaging and freight, each as its own line rather than combined into a single markup figure.
Common red flags include round numbers across every line, overhead or profit figures that don’t change when other costs do, catch-all “miscellaneous” lines, line items that don’t sum to the quoted total, inconsistent units across lines, and tooling costs with no visible amortization basis.
his varies by industry and product type. Manufacturing suppliers commonly report net margins in the 5-15% range, while specialized service or engineering-heavy suppliers may run 20-30% or higher. Treat these as a general sanity check for outliers, not a fixed rule, and benchmark a specific quote against comparable vendors in your own supply base for anything a negotiation actually hinges on.
Ask for the basis behind a specific figure rather than stating a conclusion, anchor the question in an independent cost estimate rather than instinct, and focus on the specific line with a real discrepancy rather than challenging the entire quote on principle.
It depends on supplier willingness to disclose detailed cost data, is time-intensive to do properly at scale, doesn’t capture factors like quality risk or relationship value that aren’t part of the cost structure itself, and is only as reliable as the accuracy of what a supplier discloses.